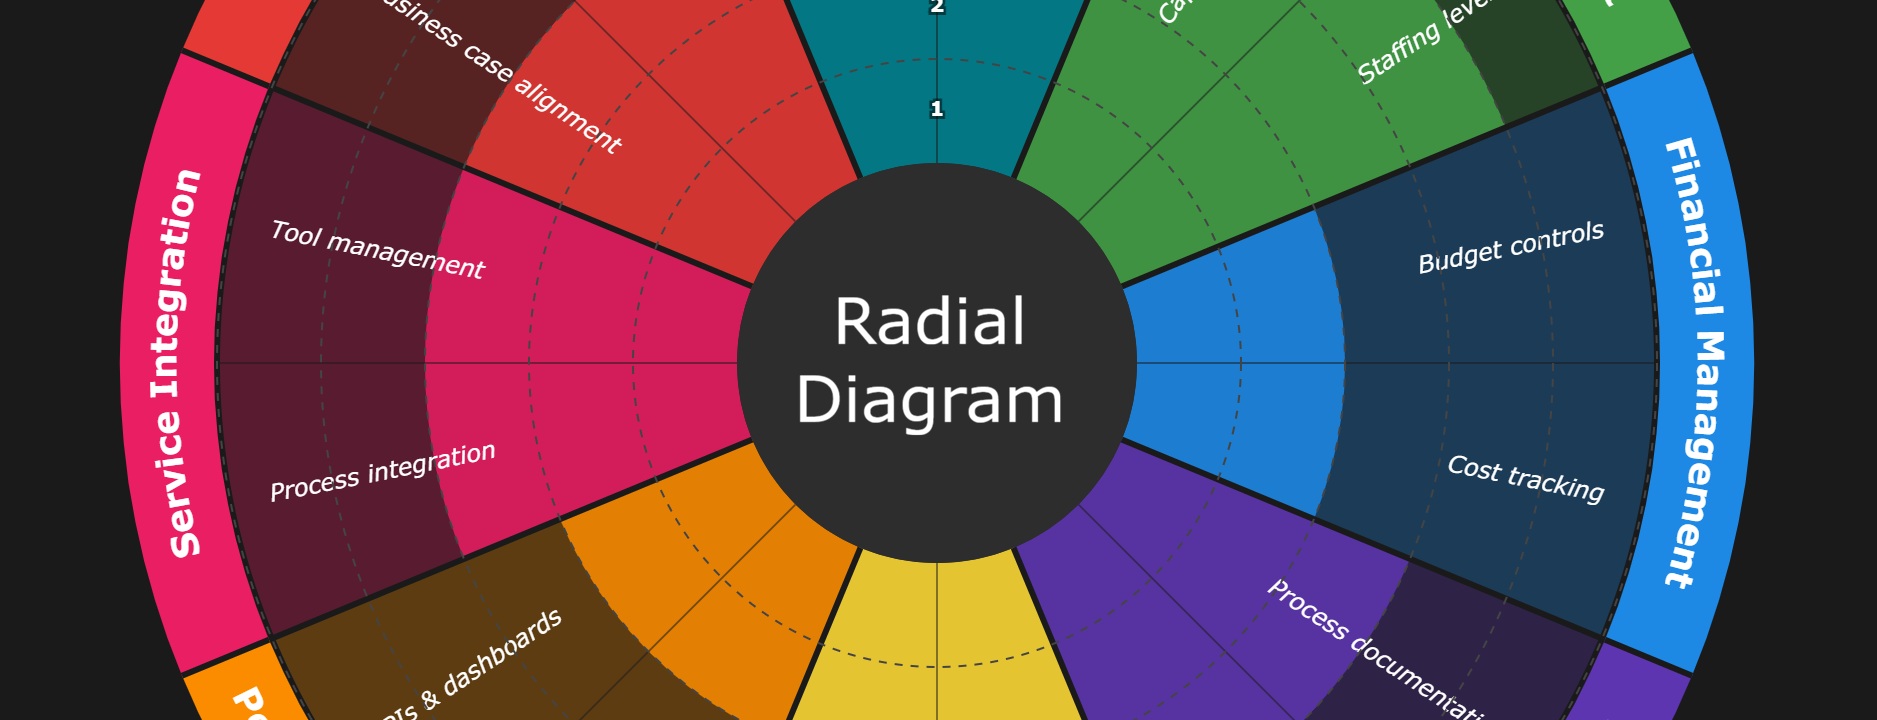
We are working on lots of new tools to help our clients get their work done more easily and where we can, we will be release elements for anyone to make use of. This is the release of our Radial Diagram Generator – a lightweight, JSON-configurable tool for creating radial diagrams.
The Radial Diagram Generator creates professional-looking circular/radial diagrams commonly used for:
These types of diagrams are frequently seen in consulting deliverables, strategy documents, and assessment reports.
This is a library for developers to use, but if you want to have a play with it, you can see the demo page here: https://cgamanagement.co.uk/tool-demos/radial-diagram.html
Creating these diagrams manually in PowerPoint or design tools is time-consuming and inconsistent. Updating scores or labels means redrawing elements. We wanted a tool that:
The repository includes several example configurations based on real-world frameworks:
GitHub Repository: github.com/andycop/radial-diagram
or here: https://cgamanagement.co.uk/tool-demos/radial-diagram.html
git clone https://github.com/andycop/radial-diagram.gitcd radial-diagramnpm installnpm run buildnpm run demoThen open http://localhost:3000 in your browser. Select an example from the dropdown or edit the JSON configuration directly.
The JSON configuration is straightforward:
{ "_source": "Your source attribution", "size": 800, "center": { "label": "Hub Label", "radius": 100, "color": "#702082" }, "segments": [ { "name": "Segment Name", "color": "#E6A817", "facets": [ { "name": "Facet 1", "score": 3 }, { "name": "Facet 2", "score": 4 } ] } ], "style": { "segmentFontSize": 24, "facetFontColor": "#000000", "showRings": true }}This is an initial release focused on the core functionality. We’re considering:
We welcome contributions and feedback via GitHub issues.
Built with TypeScript and SVG. No external dependencies for the core renderer.
To provide the best experiences, we use technologies like cookies to store and/or access device information. Not consenting or withdrawing consent, may adversely affect certain features and functions.